Statistics: The Superpower of Making Sense of the World
2nd May 2026
Welcome to the world of statistics! While it might sound like a big, "grown-up" word, in BTH, Year 3S was able to uncover the secrets hidden in numbers. They now understand that statistics is not solely about math; it is about using data to tell stories.
The students moved beyond simple counting and started learning how to organise, represent, and interpret information. This is the moment when students stop seeing a pile of numbers and start seeing a picture.
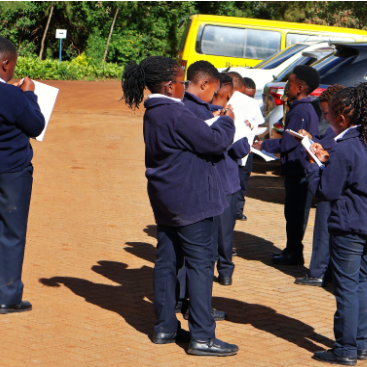
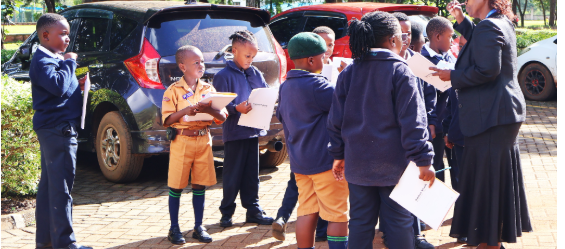
They focused on building a solid foundation in data handling after collecting raw data of the different colours of cars in the school compound. They explored tally charts using marks to keep track of counts quickly; pictograms, which represent data using fun images (e.g., one 🍎 icon equals 2 apples); and bar charts, where they learnt how to read and draw bars to compare different groups as well as interpret data by answering questions like "Which was the most popular colour?" or "How many more children liked badminton than hockey?"
This hands-on approach fostered data literacy, empowering them to navigate their surroundings with critical thinking skills essential for making informed choices. Through statistics, they evolved into curious investigators capable of interpreting data and understanding broader world implications.